We built a UK engineering education manufacturer a single AI-powered platform that replaced 29 disconnected tools their sales team was using every day. HubSpot integration, AI product matching, automated prospecting, live dashboards, and marketing analytics. All from one login.

Matrix TSL makes engineering education equipment and sells to universities and colleges across the UK. Their sales team was good. The workflow was the problem. Each rep was spending over an hour a day bouncing between HubSpot, LinkedIn, spreadsheets, and Google just to find prospects, track deals, and prep for calls. Half the working day gone before they even picked up the phone.
There was no single view of the pipeline. Finding the right contact at the right university department meant hours of digging through staff directories. Industry signals like new funding or course launches? Nobody had time to keep track. The business needed to give reps their time back and turn scattered data into something they could act on.
One platform that replaced everything. From the day it went live, prospecting, pipeline management, outreach, reporting, and marketing analytics all ran from a single login. Here's what each part does and why it matters.
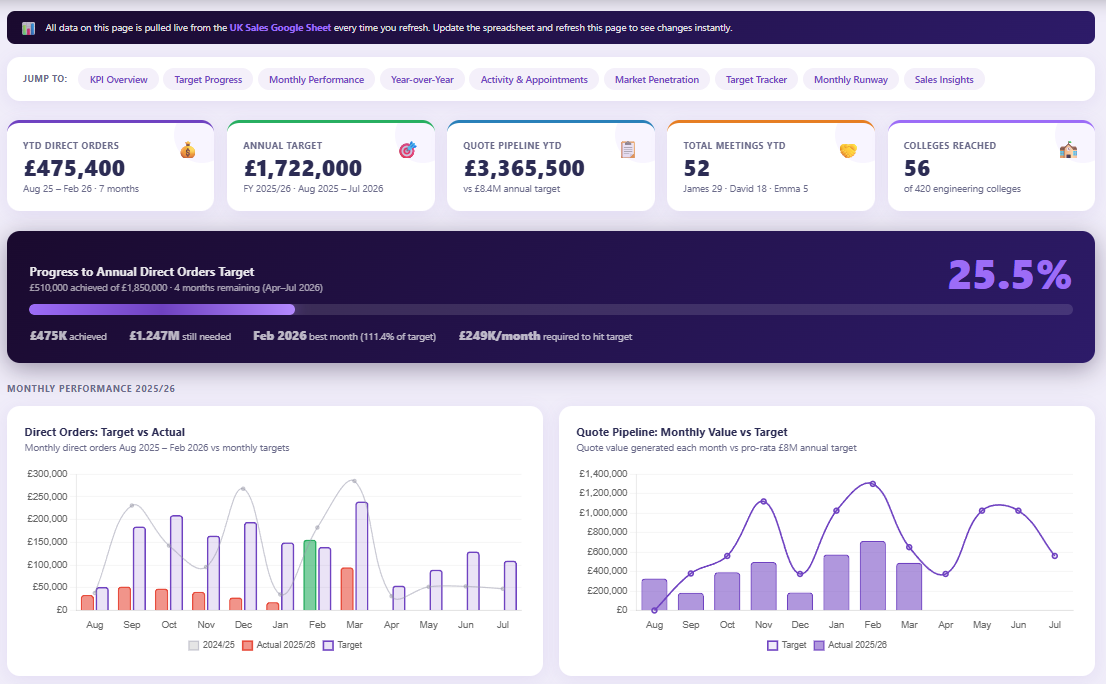
Year-to-date direct orders, annual revenue target with progress tracking, quote pipeline value, total meetings booked, and colleges reached. All pulled live from HubSpot. The dashboard shows exactly where the team stands against target at any point in the year, with a clear "25.5% achieved" progress indicator and what's needed per month to hit the annual goal.
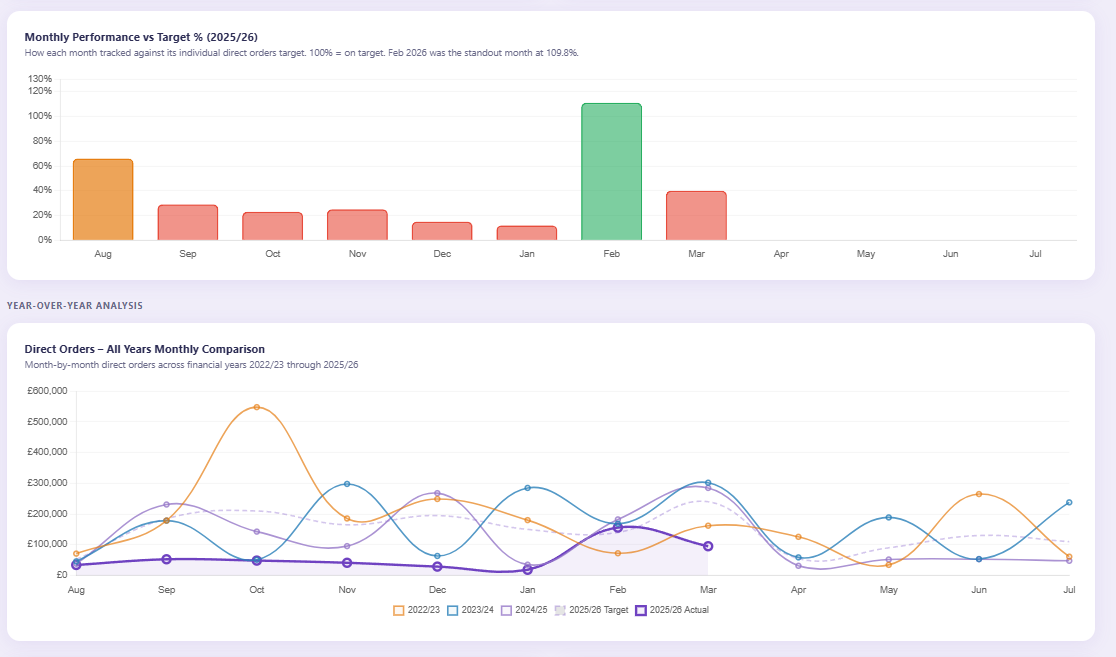
Below that: monthly direct orders vs target (actual vs forecast), and a quote pipeline chart showing how much value is being generated month by month. Reps don't need to ask their manager where things stand. They can see it themselves.
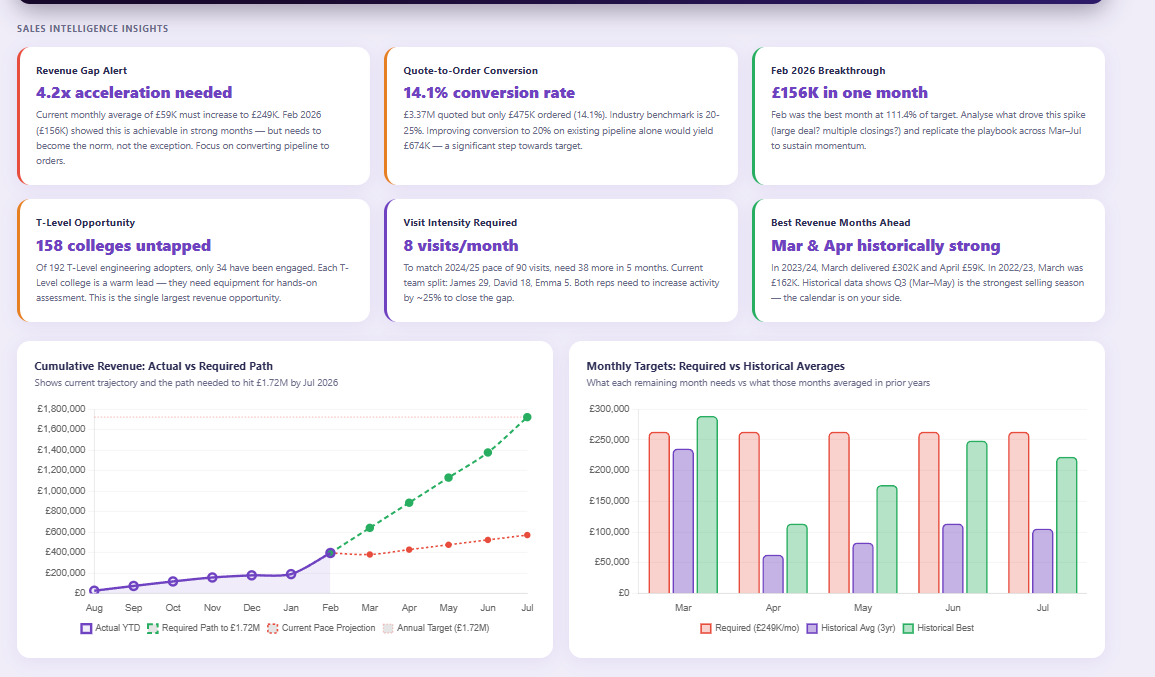
This is where the AI earns its keep. The platform analyses pipeline data and generates actionable insight cards. A revenue gap alert tells the team exactly how much acceleration is needed. A conversion rate card shows quoted vs ordered with industry benchmarks. An opportunity card highlights 158 untapped T-Level colleges where only 34 have been engaged.
Below that: cumulative revenue tracking against the required path to hit the annual target, and monthly targets benchmarked against 3-year historical averages. The team knows at a glance whether they're ahead, behind, or on pace.
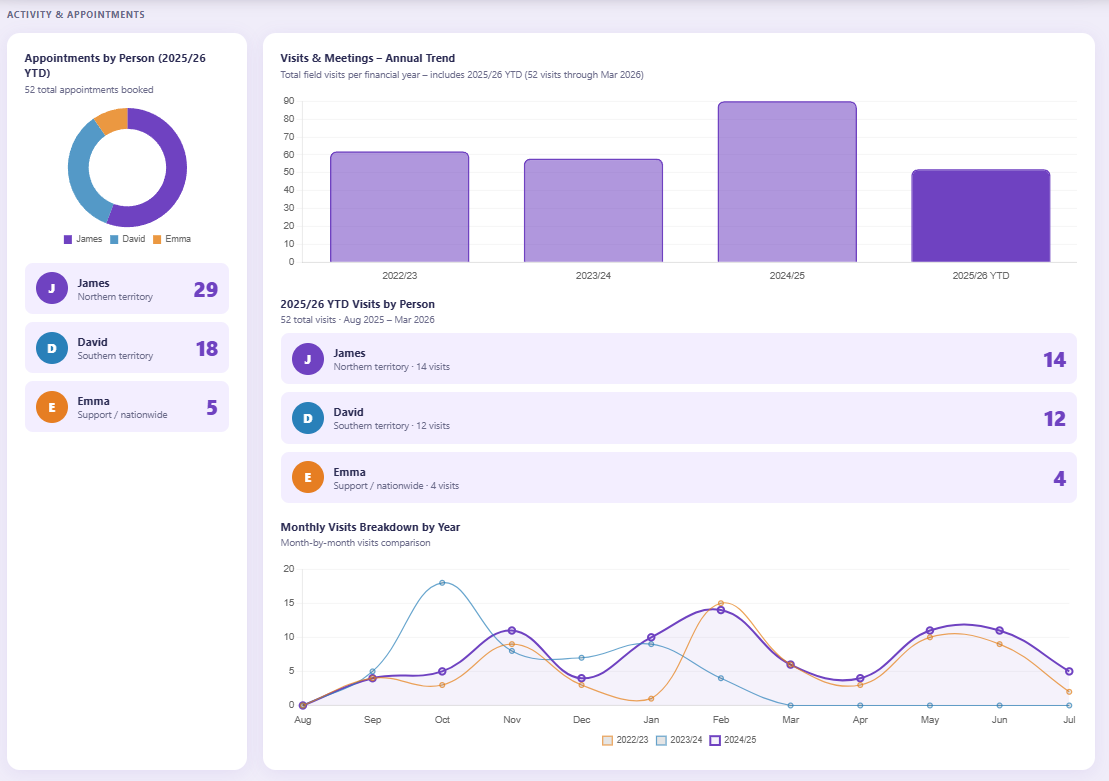
Appointments by person with a donut chart showing team split. Visits and meetings shown as annual trends across financial years so you can see whether activity is growing or flattening. Individual rep breakdown shows James on 29 appointments, David on 18, Emma on 5, with monthly visit trends for each. Management gets a clear picture of effort distribution without asking for status updates.
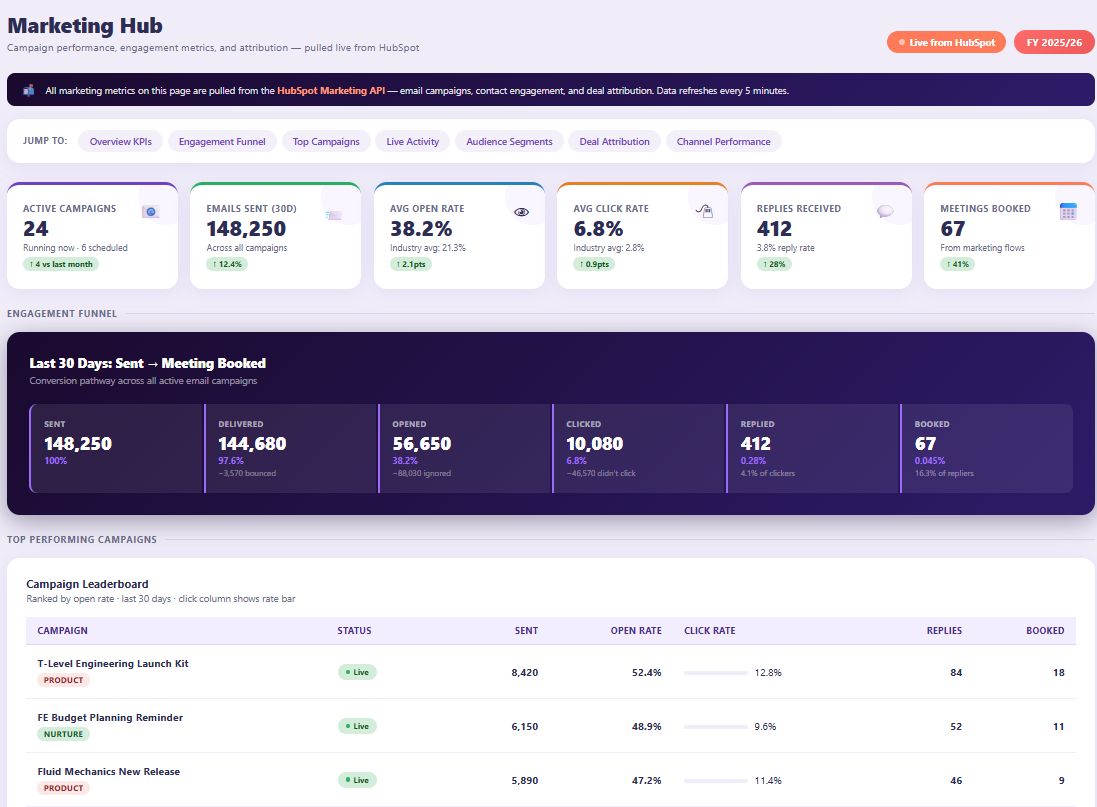
Pulls live from the HubSpot Marketing API every 5 minutes. Shows 24 active campaigns, 148k emails sent, 38.2% open rate, 6.8% click rate, 412 replies received, and 67 meetings booked from marketing alone. The engagement funnel tracks every email from sent to meeting booked: 148,250 sent, 144,680 delivered, 56,650 opened, 10,080 clicked, 412 replied, 67 booked. Below that, a campaign leaderboard ranked by open rate with the top performer at 52.4%.
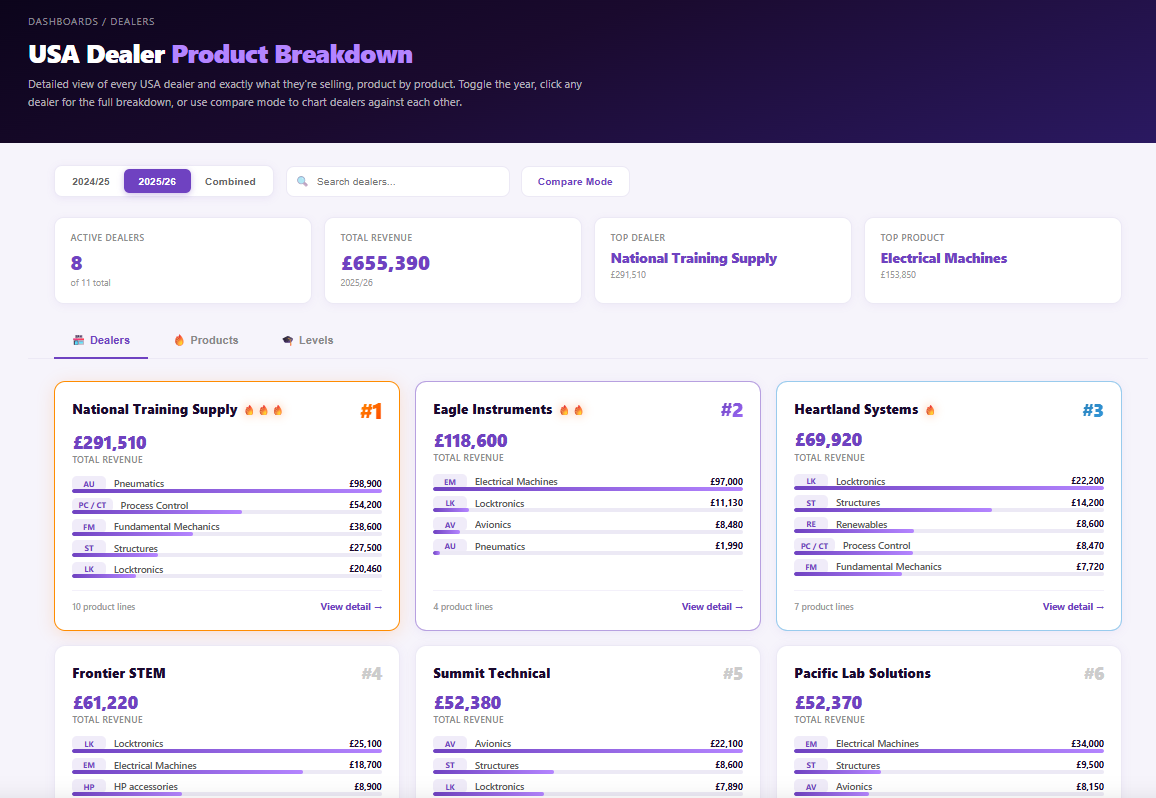
A detailed view of every USA dealer and what they're selling by product line. Toggle between financial years, search dealers, or use compare mode to chart them against each other. The top card shows 8 active dealers generating £655,390 in total revenue, with National Training Supply at #1 with £291,510. Each dealer card breaks down revenue by product category so the team can see exactly where to focus distribution efforts.
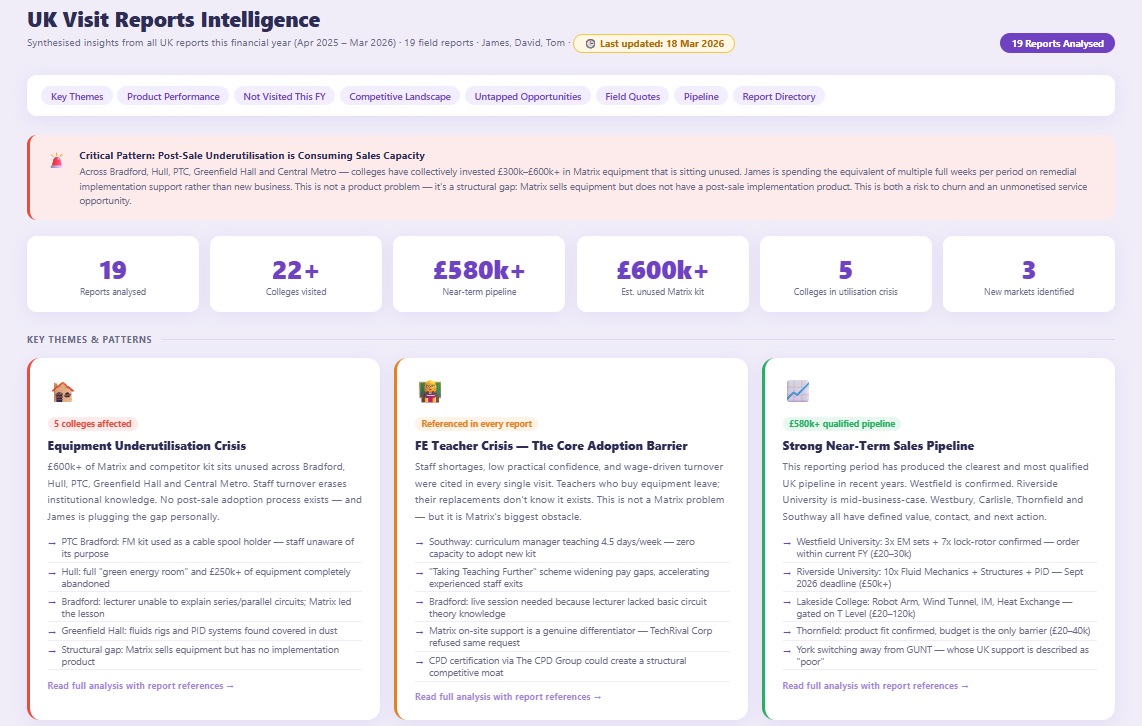
This is the feature that changed how the team thinks about field visits. The AI reads all 19 UK field reports from the current financial year and synthesises them into key themes and patterns. It found that £300k to £600k of Matrix equipment is sitting unused across colleges because staff turnover erases institutional knowledge. It identified 158 T-Level colleges as untapped opportunities. It flagged a £580k+ qualified pipeline and 3 new markets. None of this was visible before because nobody had time to read and cross-reference 19 reports.
The difference was immediate. The sales team now works from one platform that handles prospecting, pipeline, product questions, outreach, marketing attribution, dealer tracking, and AI-powered reporting. Each rep got back around an hour a day. Across the 3-rep team that's roughly 15 hours a week or close to 690 hours a year of manual admin work replaced. Lead sources that nobody had time to check are tracked automatically. University prospecting that took all morning gets done in minutes. Visit reports that used to sit unread in shared drives now get synthesised into actionable intelligence within hours.
AI can match products to customer needs automatically, monitor industry news for sales opportunities, consolidate CRM data from multiple sources, and give reps a single dashboard instead of switching between tools. In this case, it saved each rep around an hour a day — roughly 15 hours a week and ~690 hours a year across the 3-rep team.
Yes. We built a custom integration that pulls HubSpot contact and deal data into a unified platform alongside LinkedIn data, web scraping, and AI-powered product matching. The CRM stays as the source of truth while the AI layer adds intelligence on top.
The Matrix TSL platform was built and deployed in phases over 8 weeks. The core dashboard and AI assistant went live in week 4, with additional features like news monitoring and competitor tracking added in subsequent sprints.
Book a call and we'll figure out what would make the biggest difference.
Book a call